
Why the Standard Approach Falls Short
In a normalized CMS program, outperformance is challenging to sustain indefinitely. High performers tend to experience margin compression as benchmarks and normalization effects catch up. Underperformers often improve mechanically through the same program dynamics. Forecasts that ignore reversion tend to overstate the durability of outliers—leading to mispriced contracts and unexpected compression when results revert toward the mean.
Our Model: Conditional Mean Reversion
We estimated reversion effects empirically using Taxpayer Identification Number (TIN)-level performance data from 2021–2024, split into:
- Training TINs (used to estimate model parameters)
- Held-out TINs (a separate set reserved for validation and performance testing)
The core model estimates:
Expected MLRReverted=μ+ρ⋅(MLRPrior−μ)
Where:
- μ=1.00 (CMS-implied program mean)
- ρ= reversion coefficient that decreases as panel size increases and starting MLR approaches μ
This equation captures that:
- Smaller panels revert more because they are noisier and more volatile
- More extreme MLRs revert faster because large deviations are less stable in a normalized program
Visualizing Conditional Reversion
The heatmap shows the empirically observed reversion impact mean across combinations of panel size and starting MLR. It provides a granular view of how performance is expected to move back toward the CMS program mean of 1.00, and it highlights that reversion is both asymmetric and conditional.
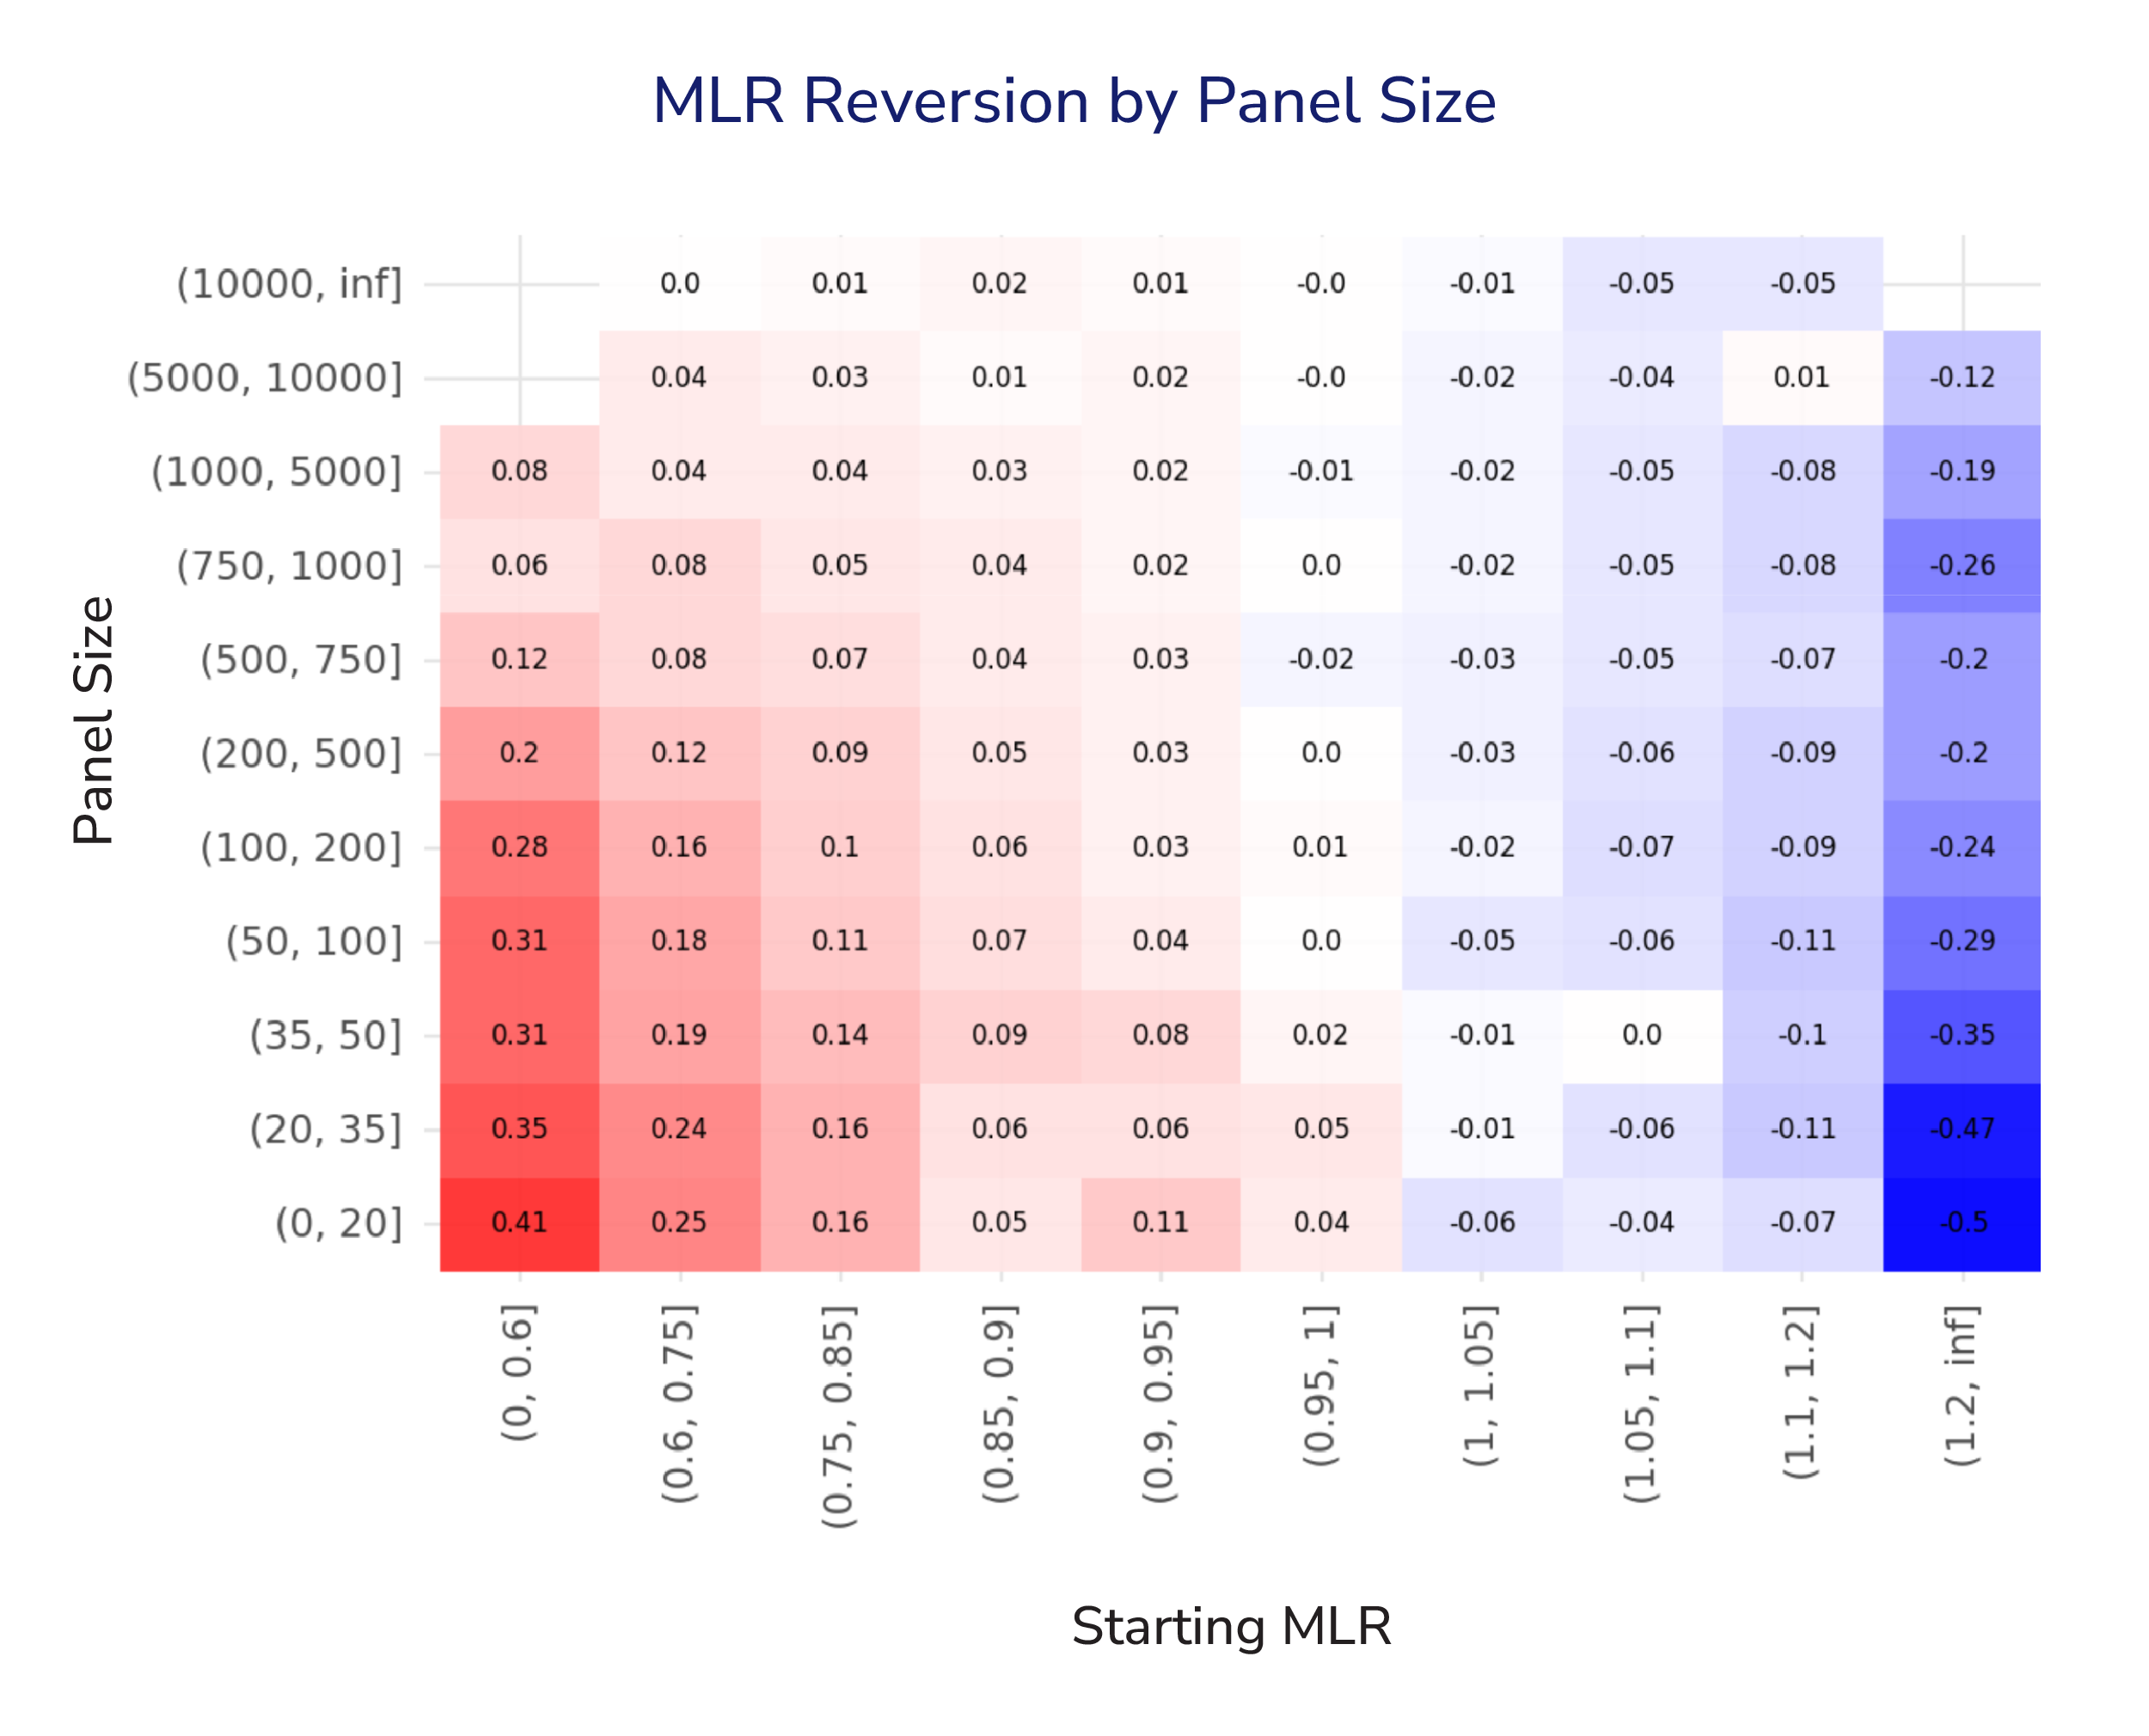
Forecasting Gravity Wells:
Treat each cell in the heatmap as part of a gravitational field around the program mean. The strength of the pull back to the center depends on both: starting position (initial MLR) and mass (panel size).
Small practices behave like asteroids—easy to knock off course and quick to drift back. Large practice behave more like planets–stable, with limited movement.
Modeling this gravitational effect doesn’t just improve accuracy. It reflects the actual “physics” of CMS programs: performance re-centers, and the path back depends on where you started and how much scale you have.
Key Observations
Magnitude of Reversion Is Conditional, Not Uniform
For practices with small panels (<100 lives), mean reversion is stronger and more directional: low starting MLRs tend to rise (red), and high starting MLRs fall (blue). This is consistent with higher volatility in small samples and stronger regression towards the mean.
Large Panels Are More Stable
For large panels (>5,000 lives) reversion is minimal across starting MLRs. Near-zero effects suggest that explicit reversion adjustments may be unnecessary–or even distortive–at this scale.
Nonlinearity matters
Reversion effects aren’t linear across the MLR spectrum. In small panels, extreme starting MLRs show a much stronger pull back toward 1.00, while values closer to the mean move far less. Practically: the further performance sits from the mean, the stronger the correction—consistent with population churn and clinical plausibility.
Takeaway
Outcomes aren’t guaranteed to repeat year over year. In fact, in some CMS programs, performance naturally drifts back toward the mean (around a 100% MLR) due to built-in dynamics like random high-cost claimants and risk-score normalization. Our goal at Pearl Health is to estimate the size of your practice-specific “pull” so you can plan for the headwinds they may face when trying to match—or outperform—prior-year results.
Notification
The content of this blog post, resources described herein, and any related discussions ("Materials") are for informational purposes only. The Materials are not intended to provide medical, legal, compliance, billing, or business advice and may contain inaccuracies or be incomplete. Pearl makes no representations or warranties regarding the Materials and expressly disclaims all warranties, express or implied. Pearl assumes no liability for any decisions made or actions taken in reliance on the Materials.
Pearl Health is powering the future of healthcare
We’re a team of physicians, technologists, and risk-bearing experts with a passion for enabling our partners to deliver better care and reduce health system costs. Want to learn more?

